
Python practice: Using Excel data
The pandas library offers the possibility to read, edit and change data from Excel workbooks using Python.

(Bild: Heise Medien)
- Walter Saumweber
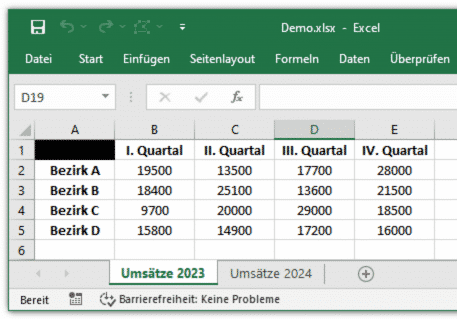
Program-side access to Excel is interesting for many areas of application. It is therefore not surprising that Python provides libraries for this purpose. In addition to pandas, openpyxl should also be mentioned, whereby pandas itself uses openpyxl in parts. Both libraries support all Excel formats, including the .xlsm macro file type. The following code examples are based on an Excel workbook Demo.xlsx with the worksheet Sales 2023. The table is deliberately kept simple with five rows and five columns, but of course the following examples can also be reproduced with any other Excel workbook; the size of the worksheet does not matter.

Die Beispieldateien zum Download
Install pandas
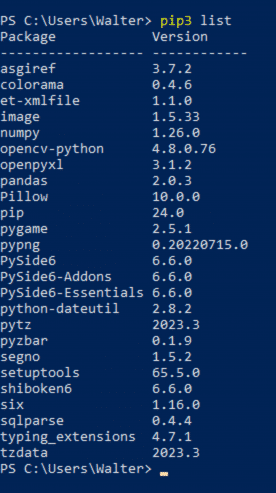
The pandas library is not included in the standard Python package and can be installed for Python 3 on the console with the command pip3 install pandas. The PyCharm IDE makes installing libraries particularly easy. It recognizes if a library is not available and offers to install it automatically. To do this, write the import command in the editor as if the library already existed. When hovering with the mouse over the name highlighted in red, a pop-up window appears with the install command.
The pandas library in turn uses the NumPy and openpyxl libraries, which the installation of pandas normally contains automatically. However, it makes sense to check this and install them if necessary.

(Bild: Walter Saumweber)
Reading data from an Excel spreadsheet
Reading data from an Excel spreadsheet after importing pandas is done conveniently with the function read_excel(). The first parameter is the name of the Excel file to be read, including the path if necessary. By default, without further parameters, read_excel() reads all data from the first worksheet.
import pandas
data_frame = pandas.read_excel('Demo.xlsx')
The function saves the read Excel data in a DataFrame (class pandas.core.frame.DataFrame), in two dimensions, i.e. practically like in an Excel worksheet. For example, data_frame['I. quarter'][0] contains the value of the first cell of column I. quarter. In the Demo.xlsx worksheet, this is the turnover of district A in the first quarter (cell B2).
To get an overview of the structure of the data, you can use print(data_frame) to output the complete DataFrame or print(data_frame['<column name>']) to output only the data of one column, for example print(data_frame['I. quarter']). For example, the indices of the rows are also output, starting at 0 under the column names. The columns, on the other hand, must always be referenced by name, i.e. by specifying a string. If a column does not exist, a KeyError occurs. In the event that a column in the Excel worksheet is renamed once, it makes sense to handle exceptions in this regard:
try:
    print(data_frame['I. Quartal'])
except KeyError:
    print('Die Spalte existiert nicht')
By default, the read_excel() function interprets the data in the first row of an Excel worksheet as column headings. For cells that are empty in this row, the DataFrame saves the value Unnamed: <index>, and therefore the value Unnamed: 0 for the first cell in the example table. data_frame['Unnamed: 0'][<index>] references the row headings of this table - with data_frame['Unnamed: 0'][2], for example, you get the District C.
(Bild: Walter Saumweber)
Checking whether an Excel cell is empty
Simple data cells that are empty are filled with nan (for "not a number") in the DataFrame (however, the familiar NaN appears in the output). Therefore, developers will not get a correct result if they check for an empty string in the Python code. For example, the if condition if data_frame['I. quarter'][1] == '' is not suitable for checking the second cell of the I. quarter column via the created DataFrame. However, comparisons with 'nan' or nan do not lead to the desired result either.
There are several solutions to this problem. Firstly, the pandas library provides the isna function for checking for empty cells. The part of the DataFrame that represents the cell is passed to this function. The content check of cell B3 could look like this:
if pandas.isna(data_frame['I. Quartal'][1]):
    print('Die Zelle ist leer')
The NumPy library provides the isnan() function for the same purpose. The call does not differ from that of the isna() function. There is another, quite elegant possibility: Developers take advantage of the fact that nan is the only object for which a direct comparison with itself results in a false.
if data_frame['I. Quartal'][1] != data_frame['I. Quartal'][1]:
    print('Die Zelle ist leer')
Parameters of read_excel()
The read_excel() function provides various parameters for conditions that do not correspond to the standard. The skiprows parameter is used if the relevant data does not start in the first line. The value assigned to skiprows stands for the number of lines that read_excel() should skip, for example:
data_frame = pandas.read_excel('Demo.xlsx', skiprows=3)The parameter sheet_name determines the worksheet to be read, with the following instruction the second worksheet of the example workbook.
data_frame = pandas.read_excel('Demo.xlsx', sheet_name='Umsätze 2024')The index can also be used instead of the name, for example if there are several worksheets:
tabellenblaetter = [0, 1]
data_frames = pandas.read_excel('Demo.xlsx', sheet_name=tabellenblaetter)
In this case, read_excel() creates a Dictionary that contains a DataFrame for each worksheet. The keys form the worksheet indices or the worksheet names. The DataFrames created above can be addressed with data_frames[0] and data_frames[1] The header parameter specifies the row with the column headers, which is required if it is not the first row of the worksheet. The specification header=2 means, for example, that the row headers are in the third row of the worksheet. header=None tells the read_excel() that the Excel spreadsheet does not contain any column headers. Irrespective of this, names assigns the desired column names to a list:
spalten = ['', 'I/24', 'II/24', 'III/24', 'IV/24']
data_frame = pandas.read_excel('Demo.xlsx', names=spalten)
print(data_frame)
The output looks like this:
              I/24  II/24 III/24  IV/24
0  Bezirk A  19500  13500  17700  28000
1  Bezirk B  18400  25100  13600  21500
2  Bezirk C   9700  20000  29000  18500
3  Bezirk D  15800  14900  17200  16000
It is important to note: read_excel() expects exactly one heading for each column in the names list, even for cells that are empty in the heading row. As the header row in the Excel table comprises five columns, the names list must also contain exactly five elements, otherwise a ValueError would occur ("Number of passed names did not match number of header fields in the file").
However, it is permissible to assign an empty string - as was done here for the first element. In this case, the DataFrame for this column does not actually contain a header, and not the text "Unnamed: " followed by a column index, which read_excel() automatically assigns if there are no column headers when the function is called without a names parameter.
However, names also defines one for columns without a heading.
spalten = ['Verkaufsbezirke', 'I/24', 'II/24', 'III/24', 'IV/24']A little caution is required when using the skiprows, names and header parameters together, as they influence each other. For example, the header row of the Excel table does not count for the skiprows value if names is also used for the read_excel() call, and with a skiprows value of 2, for example, the specification header=0, without names, would mean that the header row in the Excel table is not the first row, but the third. It is therefore advisable to check again and again during the development phase that the result meets expectations.
The parameter nrows determines how many rows read_excel() reads into the DataFrame. For example, read_excel() with nrows=2 saves two rows of data plus the header row in the DataFrame. With the default value for skiprows (None or 0), these are the first three rows of the example table (including the header row). If a value is specified for skiprows, read_excel() saves the rows from the corresponding position.
The usecols parameter can be used to restrict the columns to be read. These do not necessarily have to be next to each other, but developers can assign a list of column names or indices (but only one of the two). In combination with names, the column names defined by this parameter must be specified.
spalten = ['Verkaufsbezirke', 'I/23', 'II/23', 'III/23', 'IV/23']
data_frame = pandas.read_excel('Demo.xlsx', names=spalten, usecols=['Verkaufsbezirke', 'II/23'])
print(data_frame)
Here is the output of the above listing:
  Verkaufsbezirke   II/23
0        Bezirk A   13500
1        Bezirk B   25100
2        Bezirk C   20000
3        Bezirk D   14900